What's New
1 May, 2020
What a difference a street makes: 2018 Census data
Statistics New Zealand recently released a tranche of 2018 Census data. Jo Hammer looked behind the numbers, to reveal what they tell us about people living in Takapuna, Milford and surrounding areas.
The biggest changes in the Milford- Takapuna area are the ethnicities identified with and the faiths practised, according to the Census 2018 statistics. Levels of home ownership have decreased and rental costs have increased. Meanwhile the level of personal income is a key differentiator for the individual areas within the jurisdiction of the Devonport-Takapuna Local Board.
Population
The Milford-Takapuna area saw a 6.5 per cent overall increase in population since the 2013 Census, from 34,209 to 36,423.
The areas with the highest population growth since 2013 were Takapuna West, up 10.9 per cent, and Sunnynook South, up 9.2 per cent. The lowest growth was seen in Takapuna South (1.7%) and Milford Central (1.9%), which had the same population in 2018 as it did in 2006. Conversely, the population of Takapuna West has grown by a third since 2006.
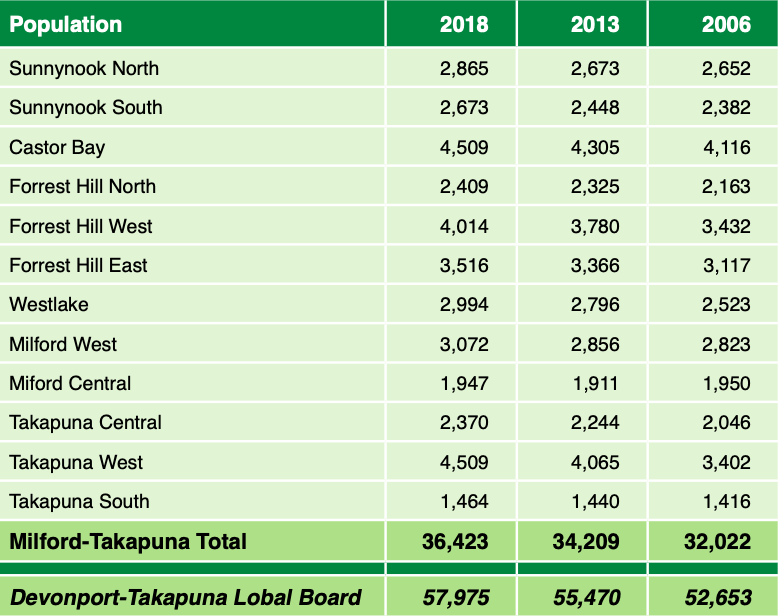
Milford Central has the highest propor- tion of over-65s, where male and female seniors constitute 30.4 per cent and 32.7 per cent of the population respectively. In Sunnynook North, the proportion of over- 65s is around one quarter of that, with 7.4 per cent of males aged over 65 and 7.9 per cent of females.
Age
The Devonport-Takapuna Local Board (DTLB) area has a higher than average median age (39.4 years) than both Auckland (34.7) and New Zealand as a whole (37.4).
Although within the Milford-Takapuna areas, there is considerable variation in median ages. The oldest residents are in Takapuna South (47.9) and Milford Cen- tral (47.2), followed by Sunnynook North (42.0), Takapuna Central and Milford West (both 41.6). Sunnynook South (35.4), Cas- tor Bay (35.5) and Forrest Hill North (35.9) have the youngest median ages.
Marital status
Just over half (52.5 per cent) of DTLB adults are married, a slightly higher rate than Auckland (49.8 per cent) and New Zealand as a whole (48.6 per cent). The highest pro- portion of married couples are in Castor Bay (57.6 per cent) and the lowest in Westlake (48.4 per cent).
Milford West (13.9 per cent) and Taka- puna Central (13.5 per cent) have the high- est proportions of divorced and separated. Westlake (10.2) has double the proportion of widowed/surviving civil-union partners compared to DTLB as a whole (4.8 per cent). In Sunnynook South, 37.7 per cent have never been married or in a civil union.
Children
The proportion of women having one or more children is highest in Milford Central (70.6 per cent) and lowest in Sunnynook South (60.4 per cent). These areas are higher and lower respectively than the proportions for the DTLB (65.6 per cent), Auckland (63.1 per cent) and New Zealand as a whole (66.9 per cent).
Ethnicity
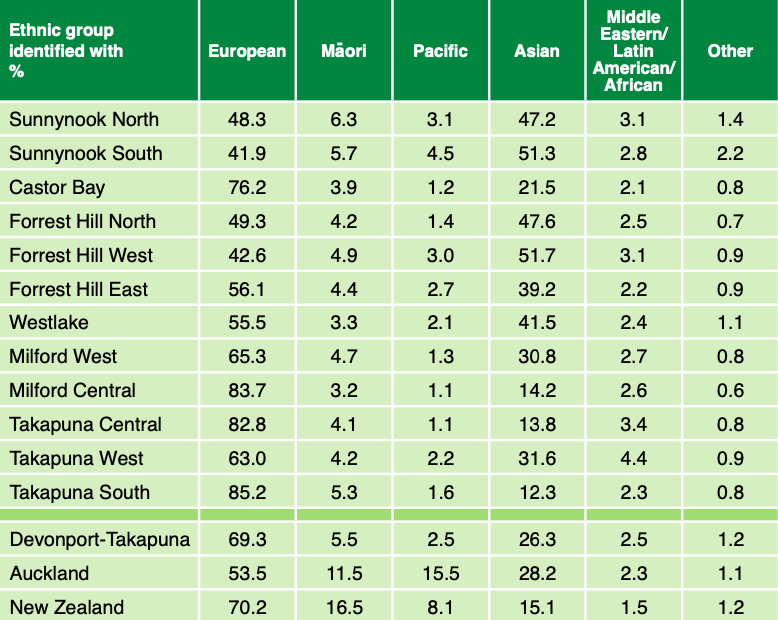
The Devonport-Takapuna Local Board (DTLB) area remains majority European in ethnicity, but this varies enormously across its constituent areas. The overall decline since 2013 in those identifying with European ethnic groups (from 75.9 per cent down to 69.3 per cent) is matched by the increase in those identifying with Asian ethnic groups (from 19.8 per cent in 2013 to 26.3 per cent in 2018).
Sunnynook South (51.3 per cent) and Forrest Hill West (51.7 per cent) have more than half of residents identifying with Asian ethnic groups; and with the exceptions of Castor Bay, Milford Central, Takapuna Central and Takapuna South, all areas have a greater proportion of residents with Asian ethnicity than Auckland as a whole.
The eastern areas from Castor Bay south have the highest concentration of European ethnicity: Castor Bay (76.2 per cent), Milford Central (83.7 per cent), Takapuna Central (82.8 per cent) and Takapuna South (85.2 per cent).
The local-board area has fewer residents identifying with Māori (5.5 per cent) and Pacific (2.5 per cent) ethnic groups than Auckland and New Zealand as a whole.
Religious affiliation
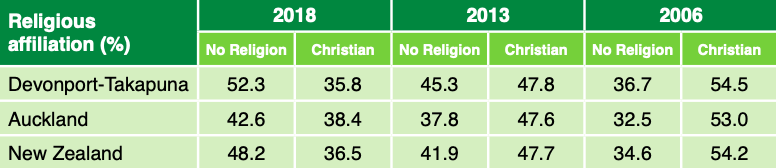
The Milford-Takapuna and the wider DTLB area are consistent in a marked in- crease over the years of those practising no religion, and a sharp decrease in those with an affiliation to Christianity.
The proportion of DTLB residents with no religious affiliation has grown by 7 per cent since 2013, and 15.6 per cent since 2006. Correspondingly, the affiliation to Christi- anity has decreased by 12 per cent and 18.7 per cent respectively over the same period.
Although the pattern was the same across all areas, the extent to which this was the case did vary. Castor Bay and Milford West reflected the trend to ‘no religion’ the most since 2013 and 2006, and Sunnynook (North and South) the least.
The largest declines in affiliation to the Christian faith were seen in Takapuna South, Milford (West and Central) and Castor Bay. The smallest declines were in Sunnynook (North and South) and Takapuna West.
Birthplace
Just over half (56.2 per cent) of DTLB resi- dents were born in New Zealand, significantly lower than the proportion of the country’s total population (72.6 per cent). Again, this varied across the local-board area. In Milford Central and Takapuna South, two-thirds of residents were New Zealand born. But in Sunnynook (North and South), Forrest Hill (North and South), Westlake and Takapuna West, less than half of residents were born in New Zealand.
The proportion of residents born in Asia (21.0 per cent) was followed by the UK and Ireland (9.6 per cent). Sunnynook South had the greatest proportion born in Asia (42.5 per cent) and Takapuna South the UK and Ireland (10.8 per cent).
Returning from overseas
Those in Takapuna (West and Central) and Sunnynook (North and South) were living overseas in the greatest numbers in the year prior to the 2018 Census. Overall, 4.8 per cent of DTLB residents were overseas the previous year, compared to 3.6 per cent of those in Auck- land and 2.7 per cent nationally.
Highest qualification
The attainment of academic and voca- tional qualifications was broadly similar within the DTLB area, although this varied somewhat from the pattern seen nationally. The largest variations were in the proportions
with no qualification (significantly lower for the DTLB area at 8.4 per cent compared to 18.2 per cent nationally); and those who had attained bachelors degrees or equivalent (22.9 per cent for DTLB, compared to 14.6 per cent nationally).
Takapuna (Central and South) and Castor Bay had the highest incidences of quali- fications at NZQA levels one to four, and Milford Central at levels five and six.The proportion of people holding bachelors degrees and other level-7 qualifications was highest in Takapuna West (25.0 per cent). Takapuna South had more who had attained postgraduate qualifications (honours and masters degrees, and doctorates).
The proportion of those holding overseas secondary qualifications varied between 4.5 per cent and 13.9 per cent and was around double national levels (5.9 per cent) for Sunnynook, Forrest Hill (North and West) and Westlake.
Employment and occupations
Overall, 49.9 per cent of the DTLB area was in full-time employment at the time of Census 2018, a similar proportion to Auckland (51.9 per cent) and New Zealand as whole (50.1 per cent).
Sunnynook North had the highest rate of full- time employment (55.2 per cent), while Milford Central had the lowest (41.3 per cent), as well as the highest level of non-participation in the labour force (41.5 per cent).
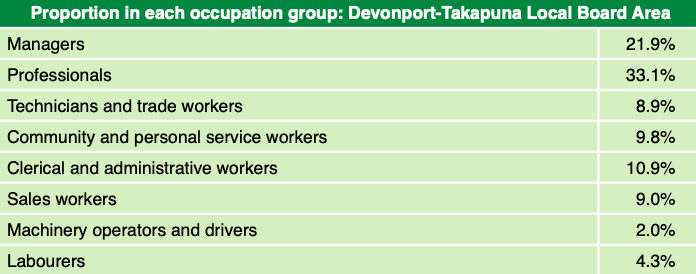
DTLB had higher proportions of managers and professionals than the rest of Auckland and New Zealand, although on an area basis, there was significant local variation within the local-board geographies. Castor Bay, Milford Central, Taka- puna Central and Takapuna South had upwards of 28 per cent working as managers, and Westlake and Takapuna West had the highest proportions of working professionals (34.4 per cent).
The proportions of technicians and trade workers were highest in Sunnynook (North and South) and Forrest Hill (North, East and West). Westlake had the greatest proportion of community and personal service workers.
The DTLB area had a similar proportion of clerical, administrative and sales workers to the rest of Auckland and New Zealand, but lower proportions of machinery operators, drivers and labourers.
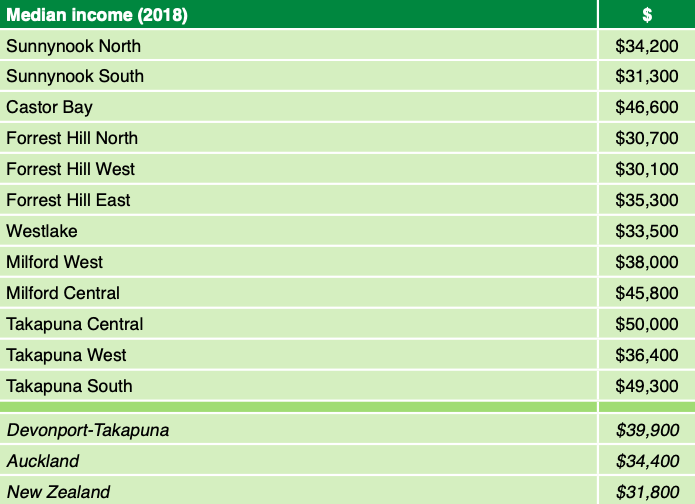
Personal income
Levels of median income varied consider- ably, with the lowest-earning areas (Forrest Hill, North and West) seeing levels of median income at less than two-thirds of the highest-earning areas (Takapuna, Central and South).
The proportion earning more than $100,000 was one in four for Takapuna Central and South, but half that for Takapuna West. Similarly the
proportions for Milford Central and Castor Bay (21 and 22 per cent) was more than double the levels of their neighbours to the north and west.
More than two-thirds of earners in Sunny- nook South and Forrest Hill (North and West) brought in less than $50,000 in personal income. This is less than the DTLB area, but comparable to Auckland and New Zealand as a whole.
Home ownership
The Milford-Takapuna area had a total of 14,178 private dwellings, of which 6.5 per cent were unoccupied at the time of the 2018 Census.
In common with Auckland and New Zealand, the trend was for ownership of tenured private dwellings to have fallen since the 2013 and 2006 Censuses. And for the DTLB, ownership at 43.1 per cent was at lower levels than regionally and nationally.
Forrest Hill West had the highest levels of home ownership (50.0 per cent), although lower levels of dwellings held in a family trust (12.5 per cent, compared to 21.1 per cent for the DTLB area). Takapuna (South and Central), Milford Central and Castor Bay all had in excess of 30 per cent of dwellings owned by a family trust.
Takapuna West (48.7 per cent), Sunny- nook South (48.4 per cent) and Westlake (45.4 per cent) had the lowest proportions of non-ownership compared to the DTLB area (35.8 per cent).
Rental costs
Takapuna Central, which saw an increase in median rent of just 3.6 per cent since the 2013 Census, was an outlier in the DTLB area, where median rental costs increased 26.2 per cent on the 2013 level of $420 per week.
The biggest rent increase was in Forrest Hill North (up 31.8 per cent since 2013 to $580 from $440). The highest median rents in 2018 were in Takapuna South and Forrest Hill (North and West), each paying a weekly $580. The lowest median rent was in Milford West, at $500 per week.
Comparing median income to median rent is a crude illustration of rental affordability (although the median income is individual earnings, while the rental cost is per house- hold). On this basis, the least affordable areas for renting were Forrest Hill West and North, and the most affordable were Milford Central and Takapuna Central.
Smoking
The proportion of regular smokers in each area is mostly similar to that for the DTLB area (5.8 per cent) and in all cases is lower than the corresponding rates for Auckland (11.3 per cent) and New Zealand (13.2 per cent) as a whole.
The northernmost areas of the local-board area — Sunnynook (North and South) and Forrest Hill North — had the greatest proportions of regular smokers, although they, along
with Takapuna West had also made the greatest strides in reducing these numbers. Sunnynook South had 2.9 per cent fewer regular smokers compared to 2013, and 9.1 per cent fewer compared to 2006.
Forrest Hill West (79.5 percent) and Castor Bay (78.2 per cent) had the highest proportion of those who have never smoked and Milford Central and Takapuna Central have the highest proportions of ex-smokers (both 21.5 per cent).
This article originally appeared in the 1 May 2020 edition of the Rangitoto Observer.

Please consider supporting The Rangitoto Observer by clicking here: